


How over 10 years, One Image has Bridged the Circular Economy and the SDGs
The Evolution, Global Impact and What's Next - Diamond Economics

I’ve spent the last decade working on circular solutions—creating frameworks, refining tools, and building platform and international partnerships. Along the way, I have seen how one particular graphic I designed as part of a broader framework has been used. When I took a look, what I didn’t expect was how far that graphic would travel, how widely it would be adopted, and how it would be used in ways I couldn’t have imagined. This article is a glimpse into that journey, and a sneak peek into the exciting new developments and new tools coming in my upcoming book, Diamond Economics.
The Evolution of my Graphics
To illustrate the journey, let’s start by looking at the three key versions of this one specific graphic that have evolved over time. Each version showcases an expanded understanding of the circular economy, evolving to be interoperable with internationally recognised taxonomies starting with the SDGs (2015), the 5 resource life cycles (2018), and the (9R)10R framework (2022). This makes it a tool that is both interoperable and flexible:
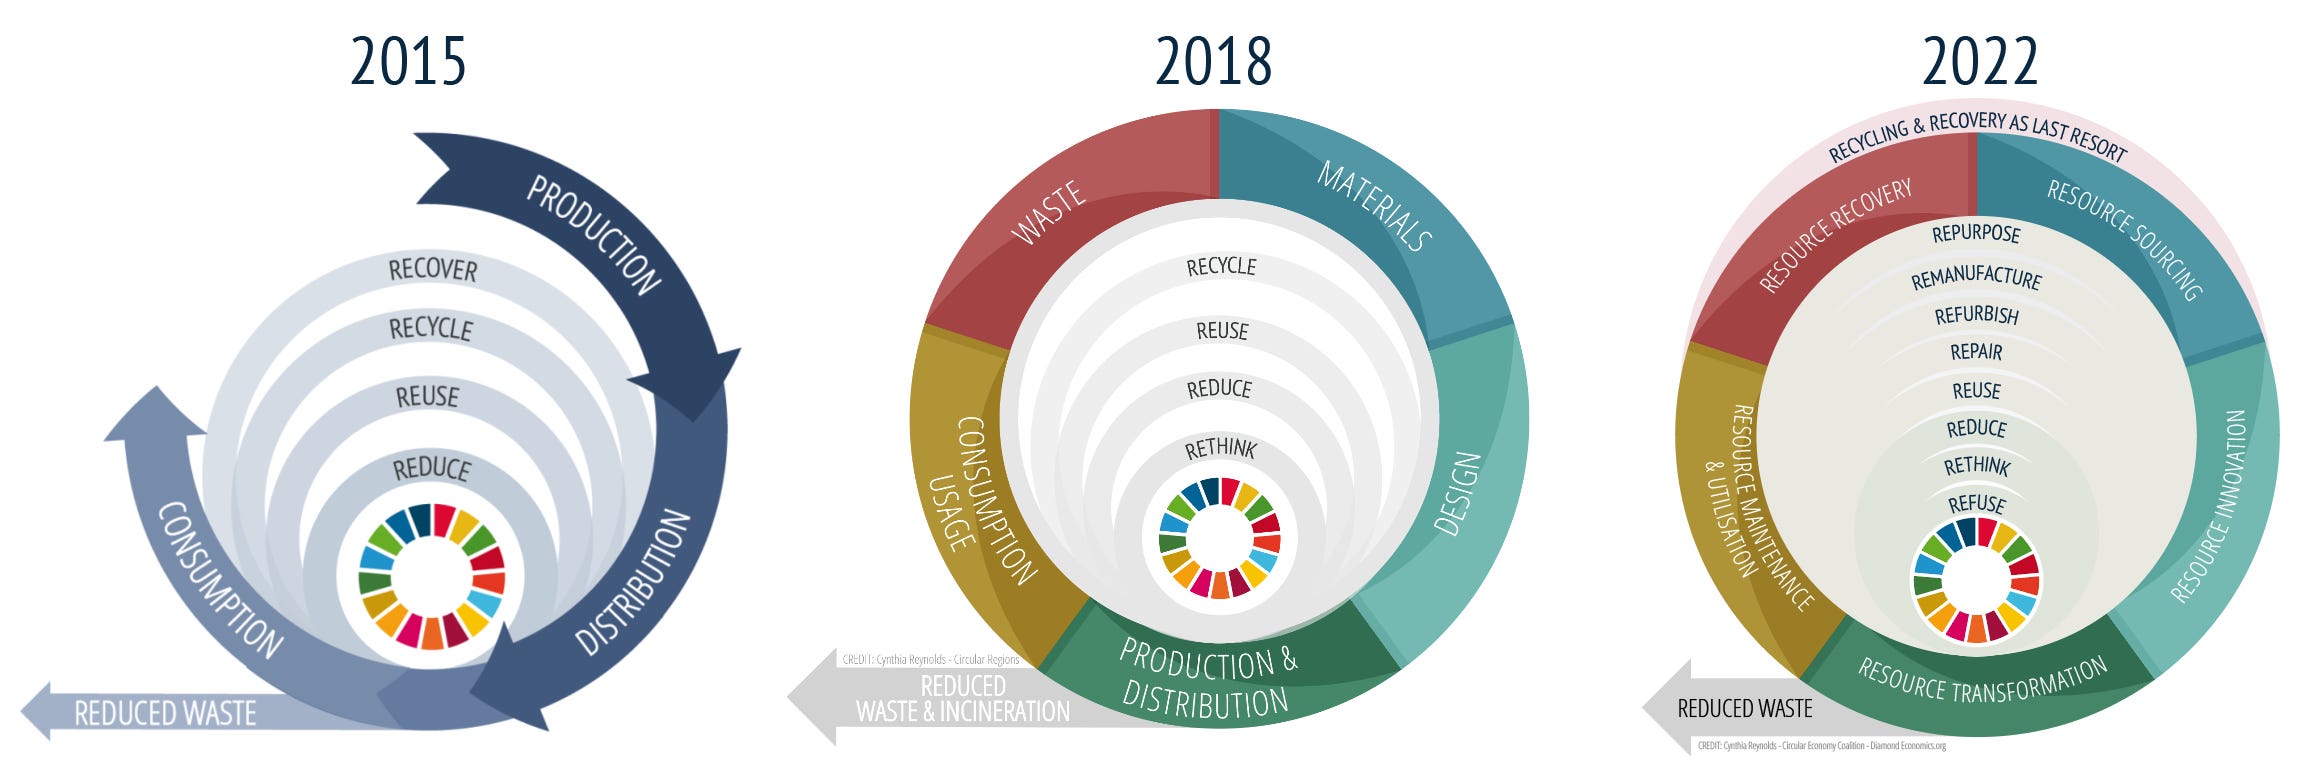
1. The Original Graphic (evolving from 2015-2018): Linked the circular economy with the SDGs, providing a foundational visual tool to connect sustainable development goals with resource management and waste reduction.
2. The Next Iteration (2018-2022): Incorporated more detailed resource transformation concepts, making the connections clearer and the visual representation more comprehensive. I first spotted the development of this in a textile report from The European Environment Agency. They later released the Framework for Enabling Circular Business Models in Europe and expanded upon it.. by then, it was already incorporated into the Circular Regions Platform and framework
3. The Current Version (2022-2024): Now includes the 10Rs—Refuse, Rethink, Reduce, Reuse, Repair, Refurbish, Remanufacture, Repurpose, Recycle, and Recover— (FUN FACT: it is often referred to as the 9R Framework but give it starts at R0 and goes to R9 there are actually 10 Rs) it helped expand the model to highlight deeper aspects of resource use and circularity.
In addition to these graphics, I’ve also developed an entire suite of visuals to complement this one, such as the 'Nano-Meta Framework Pyramid,' which represents different levels of impact, from individual actions to global initiatives.

This extensive suite of graphics conveys interrelated aspects of the circular economy, such as barriers and enablers, impacts, and societal readiness levels... These graphics are connected to an ontology and an associated digital platform for mapping case studies, policies, economic incentives, and educational and behavioural shift resources.

The process of translating these will enable this to become a multilingual thesaurus on the Circular Economy, helping bridge cultural and linguistic barriers. My upcoming book will support a community of practice with a digital companion that includes these resources. This comprehensive set has the potential to be translated into multiple languages, making it accessible to an even broader audience.
The Power of a Visual Tool
Let’s be honest: explaining complex concepts like the circular economy, sustainable development, or resource management isn’t easy. People often nod along, but unless they can see the connections, the nuances get lost. That’s where my graphics came in—as visual tools designed to break down and communicate the interconnected systems at play in circular economies, while also linking these concepts to the United Nations Sustainable Development Goals (SDGs).
I crafted them to be clear, flexible, and adaptable, allowing it to resonate with diverse audiences. Released in 2015 following the launch of the Sustainable Development Goals, the first graphic was ahead of its time in showing how the circular economy could be aligned with the SDGs—bridging two vital frameworks for global development. Little did I know it would soon appear in places I’d never expected—. The original graphic was released under a Creative Commons Attribution-NonCommercial-NoDerivatives 4.0 International license, which allows others to use and share it for non-commercial purposes, provided they give proper attribution and do not modify it. Unfortunately, that almost never happens—not even in the scientific articles has credit been consistently given.
From Science Labs to Business Hubs: A Graphic’s Journey
I recently did a reverse image search to track where this specific graphic has been used, and the results blew me away. It’s one thing to create something you hope will be helpful, but it’s another to see it embraced and adapted in so many ways. I discovered the graphic on everything from government policy documents in Norway to consultancy reports in Southeast Asia, academic papers in prestigious journals, and business blogs explaining circular practices. It’s been incorporated into presentations, and many have tried to modify it for their own purposes, including sometimes for commercial interests, often without proper adherence to the original license requirements, and even used as a cornerstone visual for community-led sustainability initiatives, which I love, as it was originally used in my own local community organisation.

https://link.springer.com/chapter/10.1007/978-981-97-0589-4_1
A Few Highlights from Around the World
- Academic Adoption: One surprising discovery was seeing the graphic featured in academic papers available through platforms like ScienceDirect and ResearchGate. It’s used to illustrate complex concepts like supply chain management and circular resource flows. Given that proper research would have identified the source, this was particularly unexpected. Should these uses be added to my ORCID?
- Policy and Government Use: The graphic has been included in public policy documents, such as the Municipality of Kristiansand’s Climate and Environmental Strategy in Norway. This demonstrates how policymakers are beginning to incorporate circular economy visuals to support sustainable initiatives at the local government level. [Link]
- Business and Consultancy Reports: The graphic has also been embraced by businesses, from tech consultants discussing Extended Producer Responsibility (EPR) to brands explaining how they integrate circular economy principles into their product lifecycles. The graphic has been adopted across many sectors, bridging gaps between technology, consultancy, and consumer brands, and showcasing its versatility in communicating circular economy principles to diverse audiences.
- Grassroots and Community Platforms: Some of the most meaningful uses I found were on grassroots organisation sites. From Nepal to North America, community groups are using the graphic to educate their audiences and communicate their missions around waste reduction and local sustainability. These are the moments that remind me of why I do this work—it is about the everyday local actions these visuals can inspire.
Seeing the Bigger Picture: Why Visuals Matter
If there’s one lesson I’ve learned from this experience, it’s that visuals are powerful tools in bridging knowledge gaps. We live in an age where attention spans are short, but images—especially those that are clear and impactful—stick with people. A well-designed graphic can be the difference between a concept that gets buried and one that sparks action.
But there’s another side to this, too: the need for proper credit. While I am thrilled to see my work being used and adapted, there are instances where it’s been shared without acknowledgment. Don’t get me wrong—this isn’t about chasing credit for the sake of it. It’s about fostering transparency and collaboration. Proper attribution helps maintain a culture of respect to those who created the value, and then the tools they develop can evolve with community input. The original graphic was released under the Creative Commons license to encourage respectful collaboration. By joining the community of practice, you can actively contribute to the ongoing evolution of the framework and graphics, while gaining access to a comprehensive digital companion. This companion includes an extensive suite of tools and resources designed for researchers, practitioners, businesses, hubs, networks, and grassroots organisations, making it an invaluable resource for anyone involved in circular economy initiatives. To learn more, visit Diamond Economics - The Book.
What’s Next? A Sneak Peek into Diamond Economics
2025 marks the 10-year milestone of the inclusion of the SDGs into my work, and throughout this last year, I have been working on my book, Diamond Economics. Just like diamonds are formed under immense pressure, my journey has been full of ups and downs—moments of intense challenge that ultimately shaped something valuable. This book builds on the foundations of my work, addressing critical issues such as the biodiversity/security nexus, bridging the Global North and South, bioregionalism, technology integration, and the use of taxonomies/ontologies. It offers practical tools to navigate these challenges. Additionally, it provides insight into my personal journey—the triumphs, challenges, and lessons learned. Diamonds are among the strongest resources we have, and through this book, I aim to show how our collaborative efforts can become equally resilient and impactful. The book dives into the frameworks and introduces new tools I’ve developed, expanding on how they can be leveraged to create actionable strategies for policymakers, businesses, and communities alike.
The book isn’t just about explaining the circular economy; it’s about defragmenting the discourse and making these complex ideas accessible and actionable. Whether you’re an entrepreneur looking to integrate sustainable practices, a policymaker crafting local strategies, or simply someone interested in understanding how these systems work, Diamond Economics has something for you.
Reach out
If you’ve come across my graphics or used them in your work, or seen it somewhere, I’d love to hear from you! The global reach of this simple tool has shown me the power of collaboration and the importance of visual communication. Let’s keep that momentum going. Share your stories, comment below, and connect with me on LinkedIn to stay updated on the book’s release.
Together, we can build systems that regenerate, create value, and thrive—not just for a few, but for all.
Meanwhile, here is a random sampling of the 100s I have found on how the graphic has been used and in what context:
- ScienceDirect - Global: Used in a published academic paper to illustrate supply chain management concepts within the circular economy in Marrakesh. [Link]
- ResearchGate - Global: Included in an academic paper on circular economy supply chain management, contributing to the discussion with a visual representation of the concept. [Link]
- Kristiansand Kommune (Climate and Environmental Strategy) - Norway: Integrated into a public policy document detailing their climate and environmental strategy. [Link]
- SBS IT (Circular Economy and Recycling) - Italy: Used on their website to explain the concept of circular economy and recycling. [Link]
- Daily Nous (Environmentally Friendly Conferences) - USA: Featured in an article discussing the planning of sustainable, environmentally friendly in-person conferences. [Link]
-Boffins Portal - Global: Incorporated in an article providing an overview of circular economy principles, pros and cons, and barriers to implementation. [Link]
- BK Bags (Circular Economy Explanation) - Asia: Used on their website to introduce and describe the concept of a circular economy in relation to their products. [Link]
- SPAS Computers (EPR Implementation Services) - India: Featured on their services page discussing professional services for Extended Producer Responsibility (EPR) implementation. [Link]
- Cleanup Nepal - Nepal: Used by the grassroots organisation to educate audiences about waste reduction and their sustainability mission. [Link]
- Dept of Bioregion - USA: Featured on their website to explain the principles of bioregionalism in action. [link]
- Greenix Blog - Turkey: Incorporated in an article about the circular economy for Turkish audiences, emphasizing the connection with sustainable practices. [Link]
- International Council for Circular Economy - India: in their I am Circular social media campaigns .

https://deptofbioregion.org/bioregionalism/in-action/

and my word, some have really gotten creative


At a presentation at The 18th Economic International Conference Challenges and Opportunities for a Sustainable Development CIRCULAR ECONOMY: PERCEPTION AMONG WINERIES OF THE REPUBLIC OF MOLDOVA


People Capital for Circular Prosperity — Sustainability Culture

creative replicas Circular Economy and Supply Chain Sustainability
